Think Like A Workfront Admin: Creating Reports Like a Pro | Advanced Views Part 1
You are officially on your way to becoming a great Workfront Administrator! You know how to troubleshoot, create a feedback queue, and you have just learned how to read and use Workfront’s API Explorer. Now, let us focus on creating reports and dashboards that are effective and prompt our users to take action.
Every report shares four common areas: Views (Columns), Groupings, Filters, and Charts. We will cover Groupings, Filters, and Charts in later blogs but for now, we are going to focus on creating Advanced Views within a report.
A View on a report displays native and custom data for a given object (the object of a report). Let’s recall the lessons learned from the API Explorer blog. For a given object, you can leverage standard and custom object data, referenced object data, and object collections. Now, let’s create a report to help workers view key performance indicators for tasks they are assigned to.
Challenge:
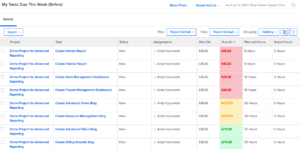
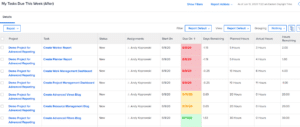
Our work license users want to see how many days are left until the task is late and they want to see how many hours they have left on their tasks.

Solution:
Your initial reaction may be to create a Task report. A Task report will work if your organization assigns a single user to a Task. If your organization assigns multiple users to a Task, you will want to create an Assignment report. Don’t worry, the text mode code will be available for both Task and Assignment reports in Part III.

In our example, we will create a Task report with two custom text-mode columns. Days Remaining, and Hours Remaining. Both custom text mode fields are not available through the standard interface.
To create both columns, you need to know the different components of the text mode code we will develop. We will leverage the following functions:
- displayname
- valueexpression
- valueformat
- textmode
The displayname function will display the label name for the column. The valueexpression function enables users to develop formulas for advanced calculations to display data otherwise not available in the standard user interface. The valueformat function allows users to display the data in a variety of formats on a report. Lastly, the textmode function is used to identify the column as custom rather standard.
In Part II, we will create the custom text mode code to create both columns: Days Remaining, and Hours Remaining.


